


Who we are
SGL Carbon is a technology-based company and a global leader in the development and manufacture of carbon-based solutions. Our materials and products made from specialty graphite, carbon fibers and composites serve many industries that are shaping the trends of the future: climate friendly mobility, semiconductor technology, LED, solar and wind energy, and the manufacture of lithium-ion batteries.
We also develop solutions for the chemical sector and numerous industrial applications that are both forward-looking and reliable. We are driven to grow with products and technologies that benefit society and reduce environmental impact.
With around 4,800 employees at 29 sites in Europe, North America and Asia, we generated sales of 1.1 billion euros in fiscal 2023.

Company
In the Company section we present SGL Carbon in more detail. Here you will find information on our corporate structure and, above all, an overview of our Business Units: Graphite Solutions, Process Technology, Carbon Fibers and Composite Solutions. We introduce our management and Supervisory Board, report on our sites and take you through our history.
We are the specialist for carbon-based materials and offer our customers tailor-made solutions. In doing so, we are involved in the major future topics of sustainable mobility, renewable energies and cross-industry digitalization. In everything we do, we aim to balance environmental, social and business aspects for the benefit of our customers, employees and stakeholders.
Dr. Torsten Derr, Chair of the Management Board of SGL Carbon
Markets & Solutions
Here you will find our trendsetting solutions, components and high-quality materials made from specialty graphite and composites. Our materials and solutions are used in future-oriented markets such as mobility, energy, digitalization, industrial applications and in the chemical industry. The product finders will assist you in your search.

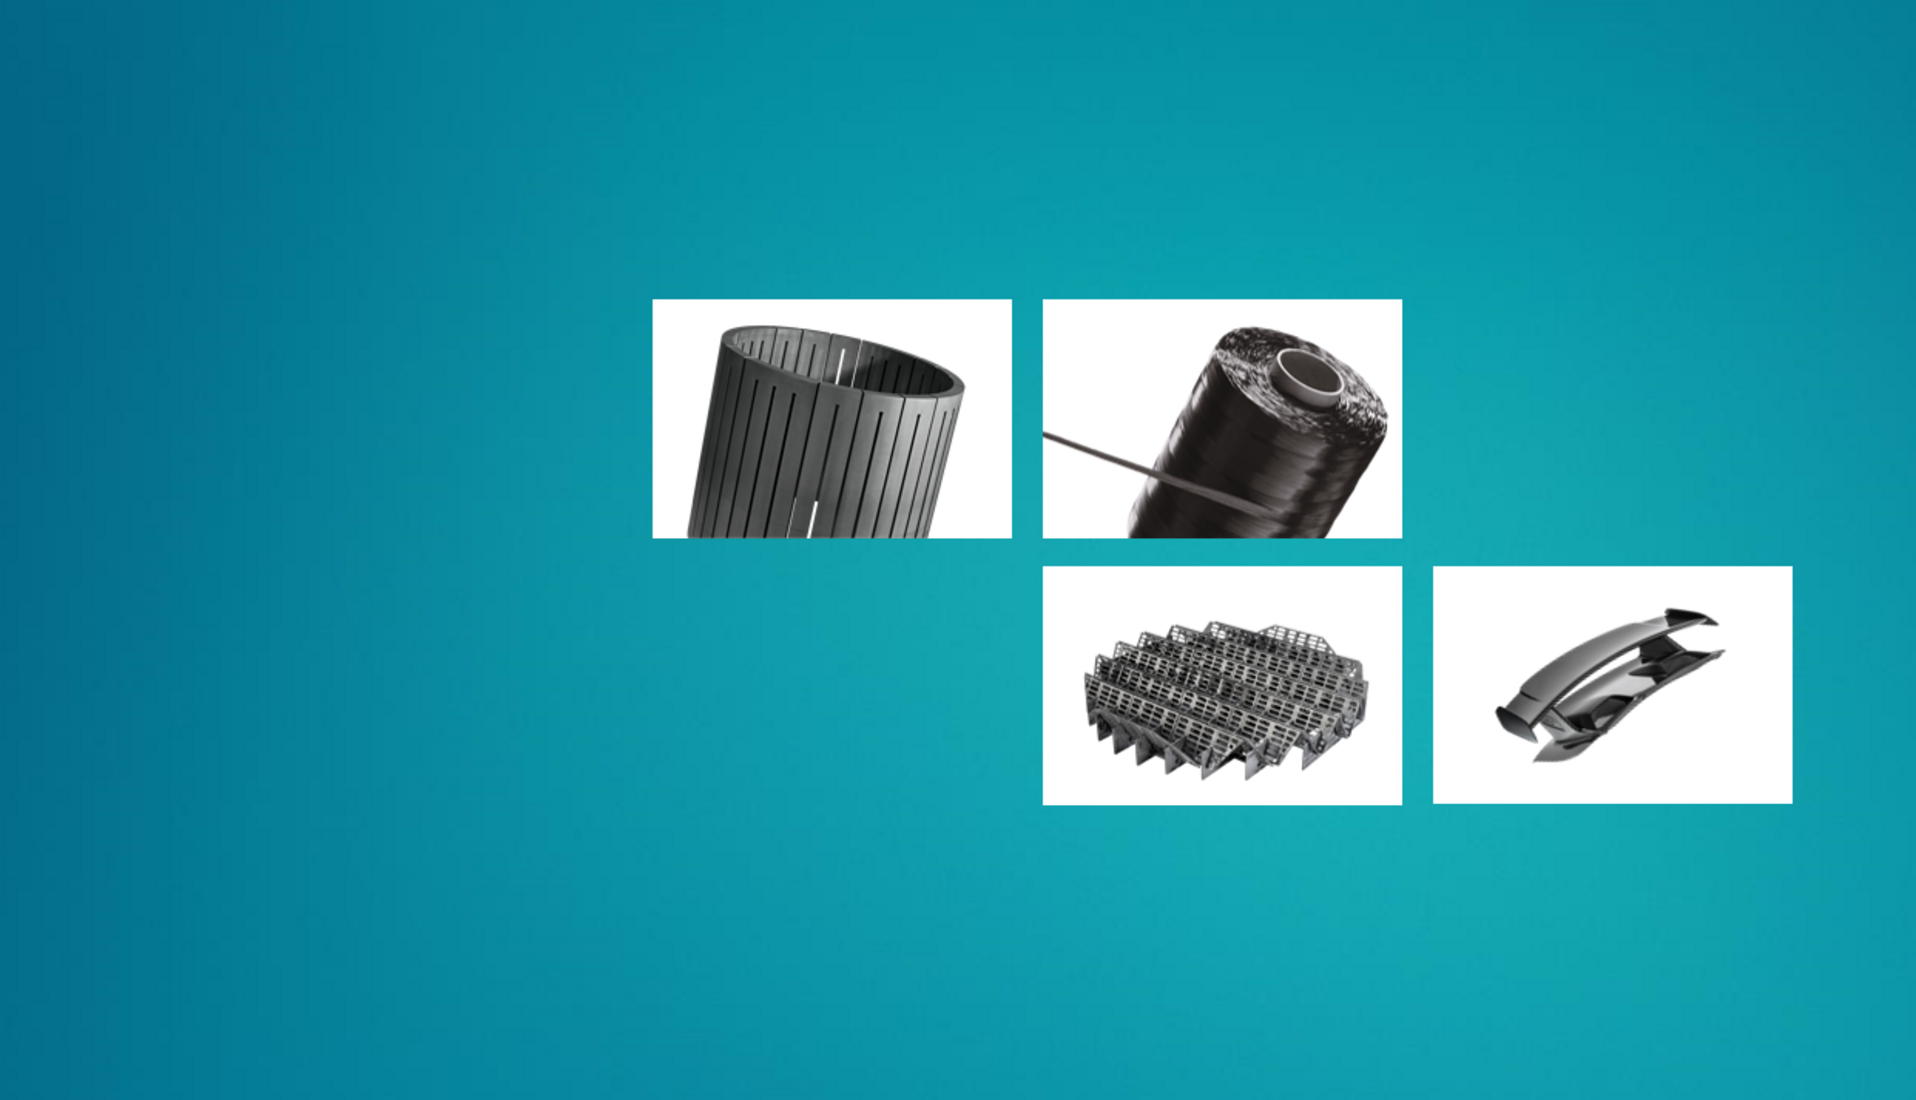
Business Units
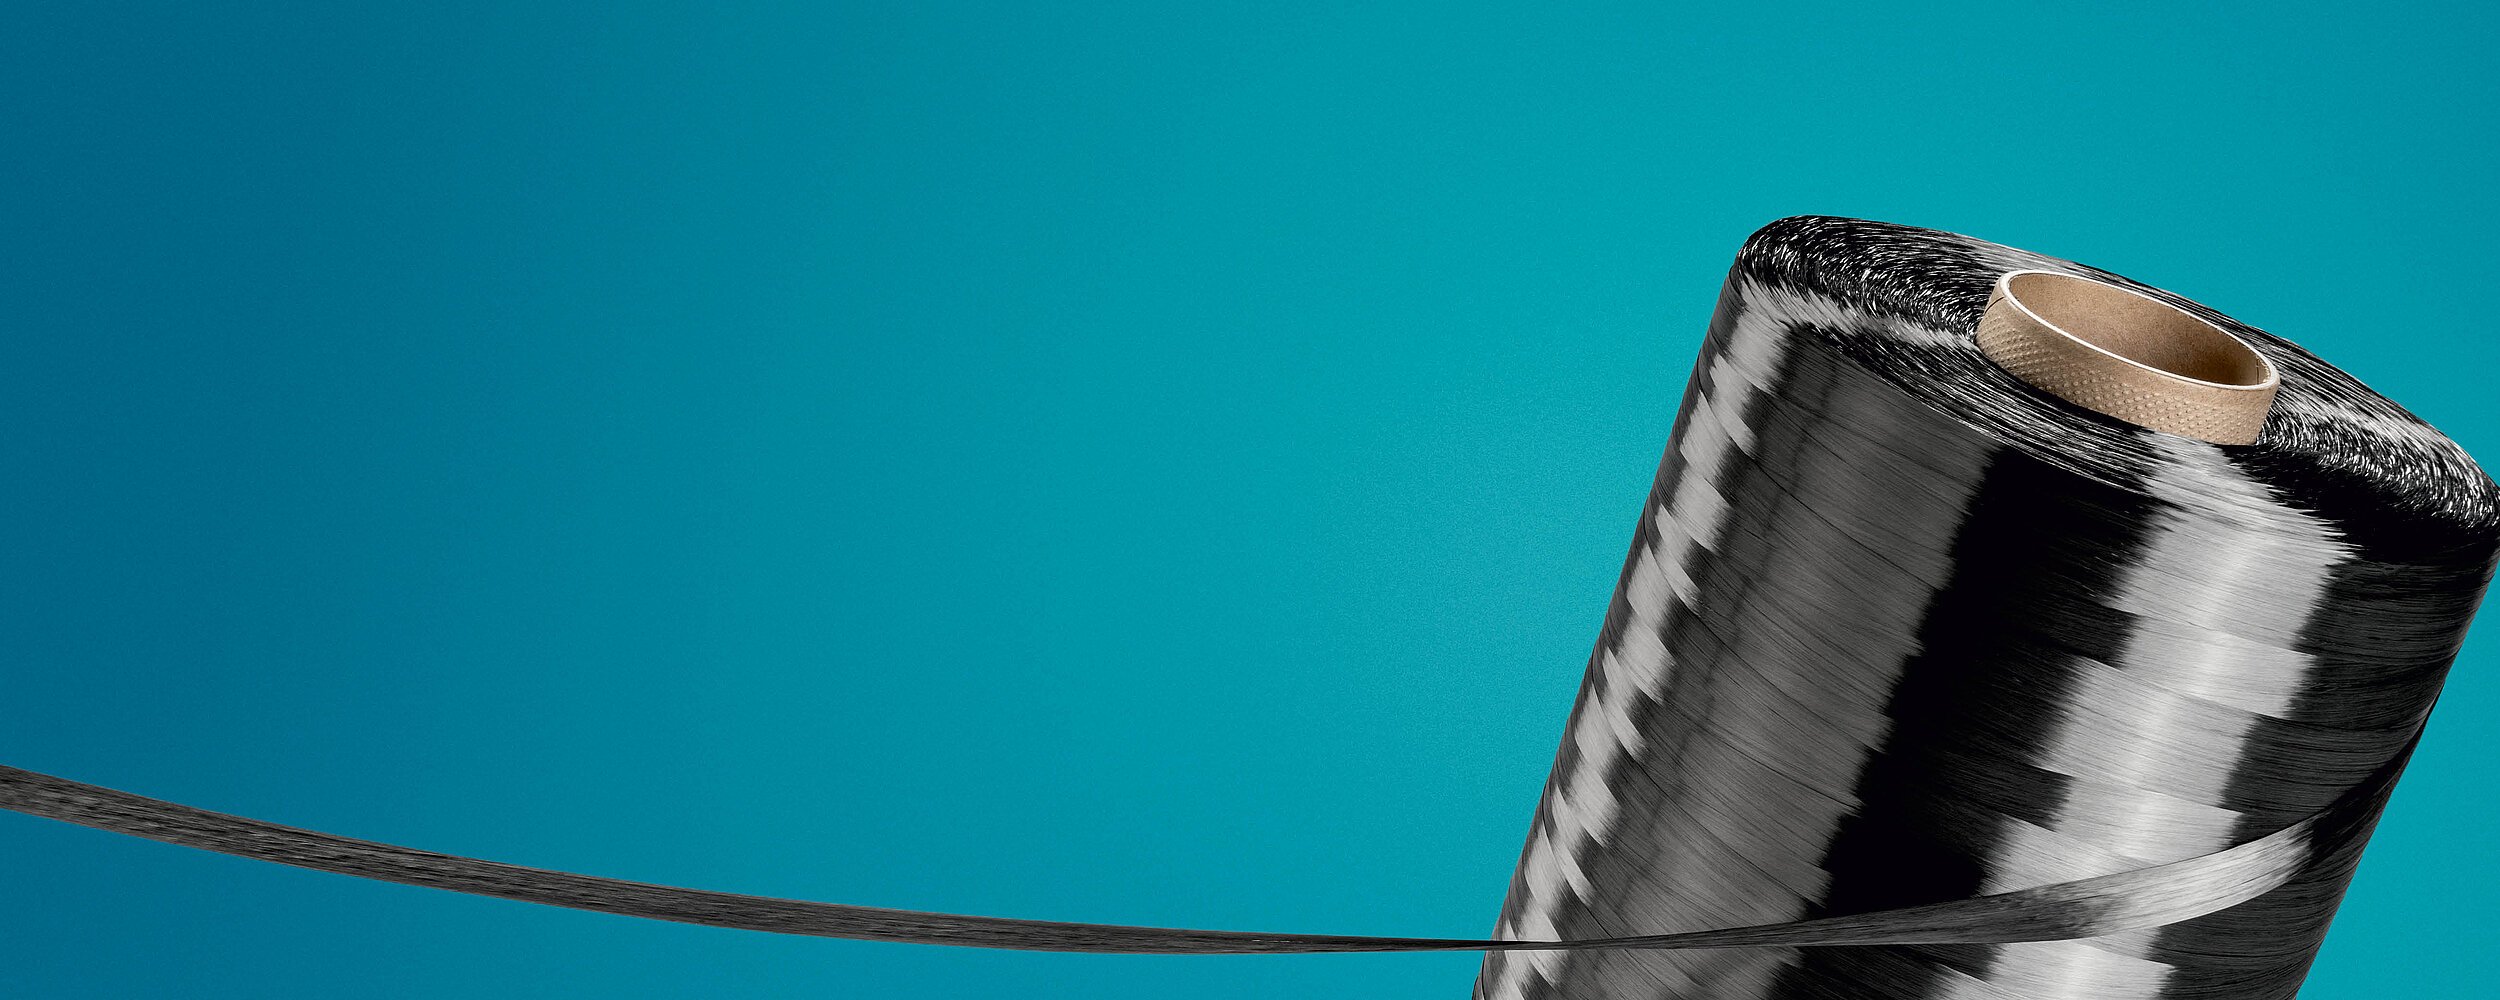
Our core business is formed by the four Business Units Carbon Fibers (CF), the basis for all processing stages of composite applications, Composite Solutions (CS), for high-tech applications requiring high strength and light weight at the same time, Graphite Solutions (GS), as the world’s leading experts in specialty graphites and Process Technology (PT) for the construction of large-scale plants for industrial applications.

Investor Relations
On our Investor Relations pages you will find, among other things, our current reports as well as all relevant information about SGL shares and SGL bonds. We aim to provide a comprehensive and continual flow of information to the capital markets and the general public about the latest developments within our company.

Newsroom
Our markets and technologies are constantly evolving – and so is SGL Carbon. In our Newsroom you will find the latest news about the various aspects of our company. From key financial figures and product innovations, to our sustainability initiatives and site news, to specialist information from our experts, we give you a wide range of insights into SGL Carbon.

Sustainability
As a global technology company, we are driven to grow with products and technologies that benefit society and reduce environmental and climate impacts. Our products, our manufacturing and management processes, and our supply chains should meet high environmental, social and governance standards. We are happy to provide you with more information on our sustainability pages.

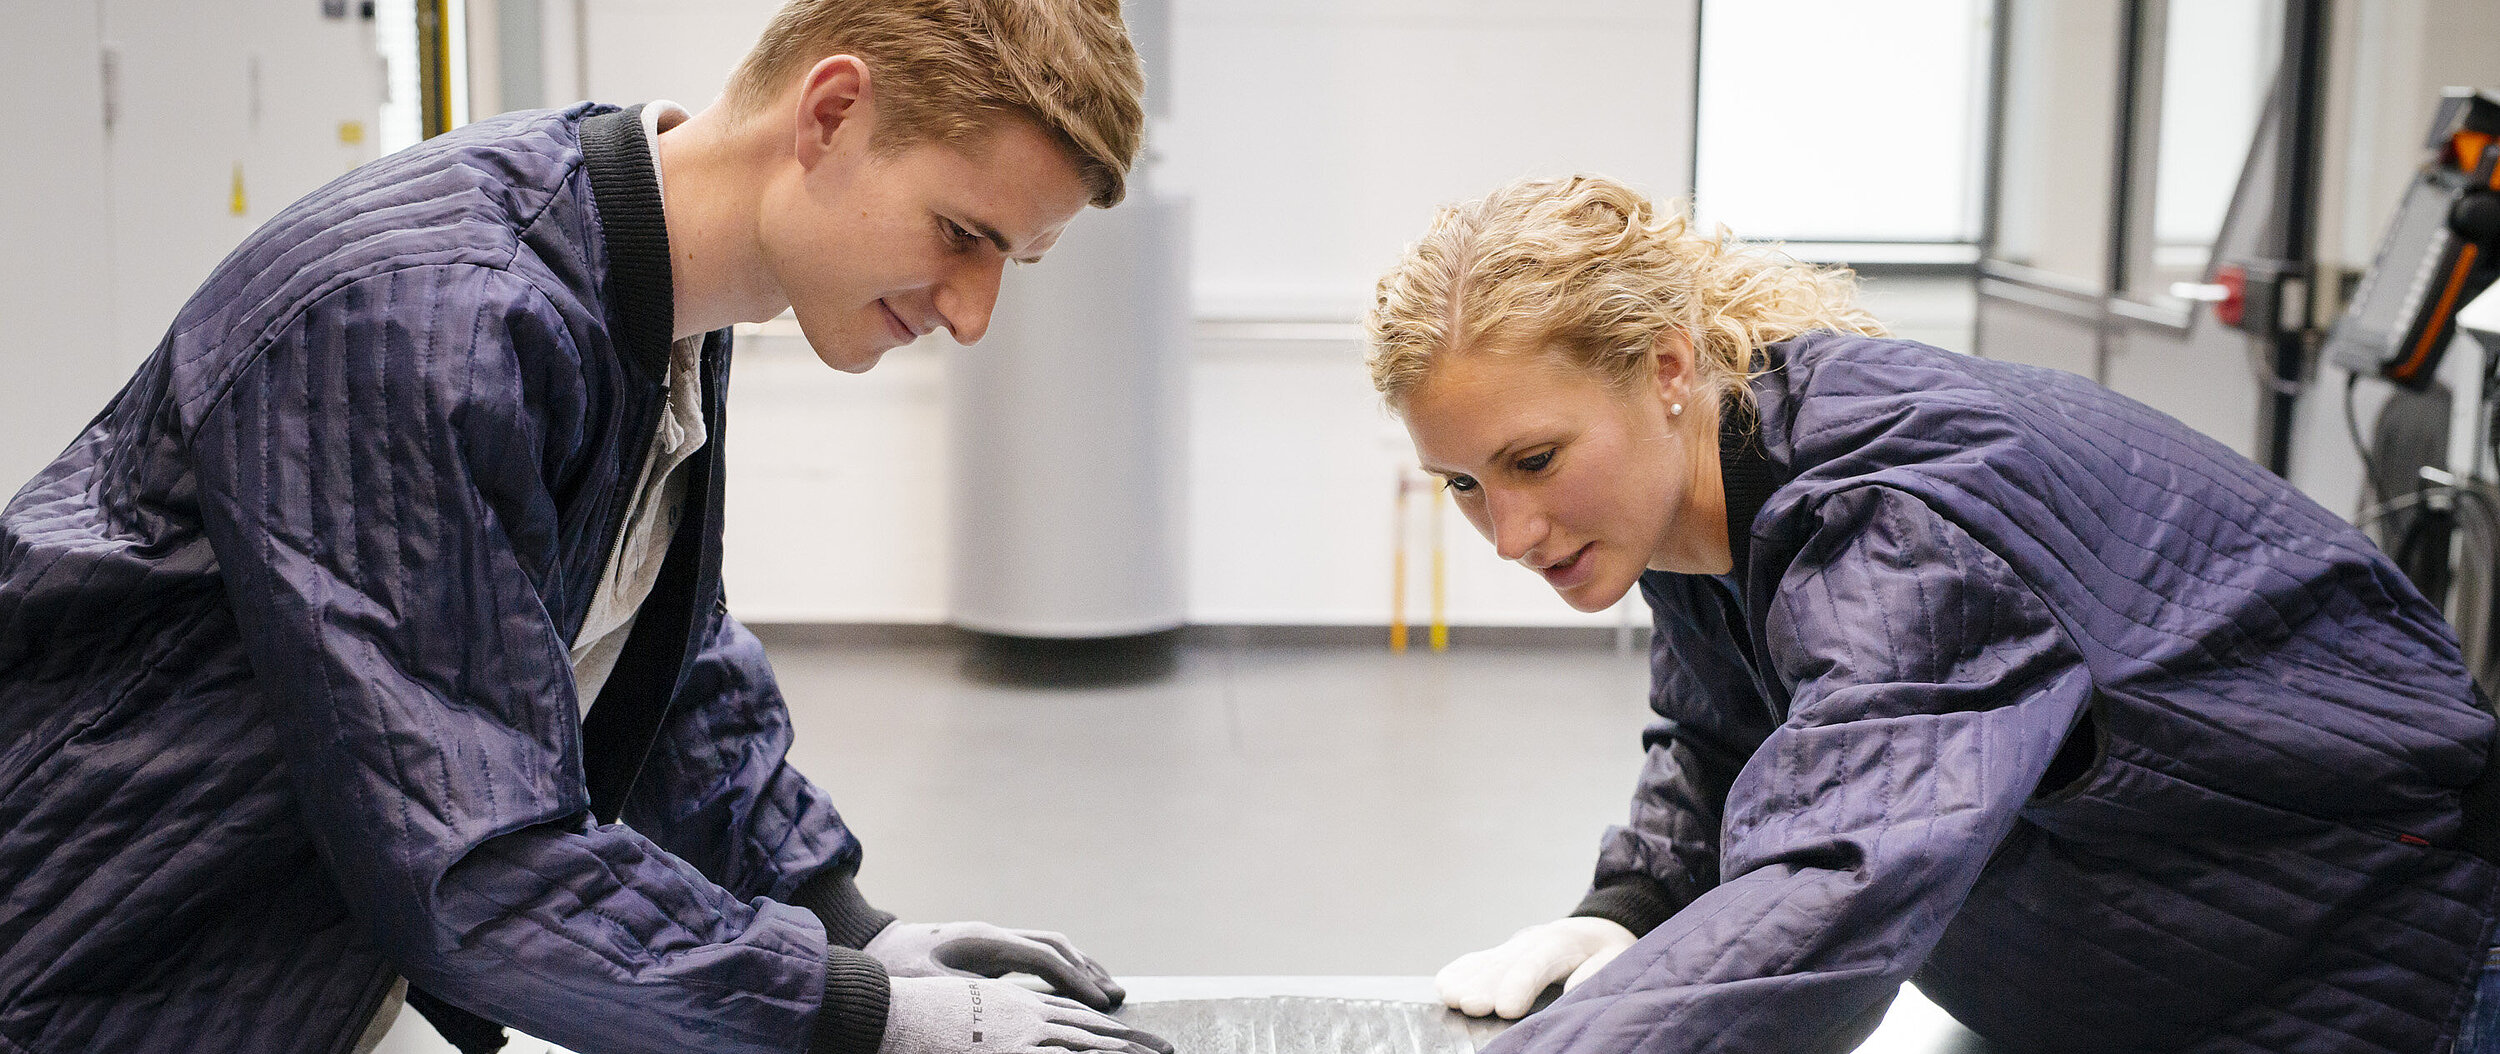
Careers
Innovative strength, team spirit, high quality standards, and individual responsibility – and working with one of the most amazing materials of our time. Together with our customers, we use these ingredients to create intelligent and pioneering solutions. Find out about our vacancies here and learn more about SGL as an employer.